Basic of Power BI
To see what the original data looks like, click on 'Transform data' under Home tab.
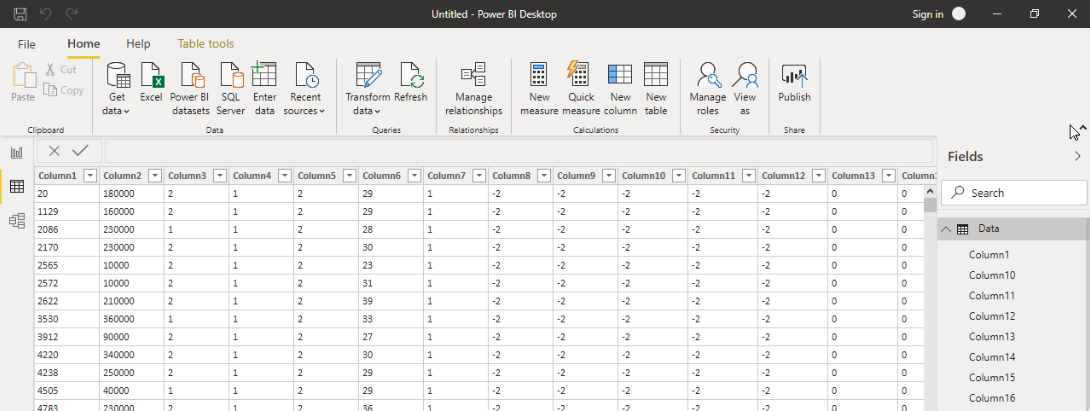
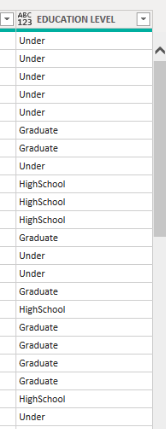
Replace value
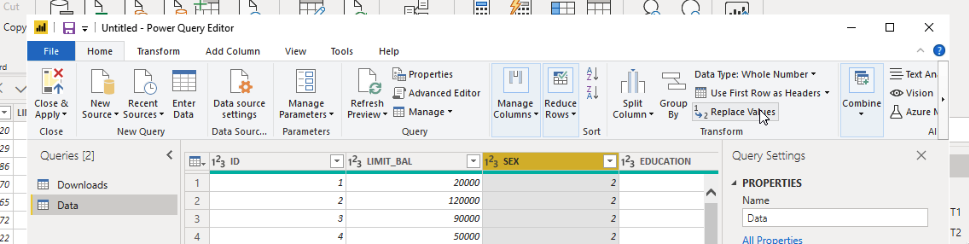
Go to Transform data and Replace Value
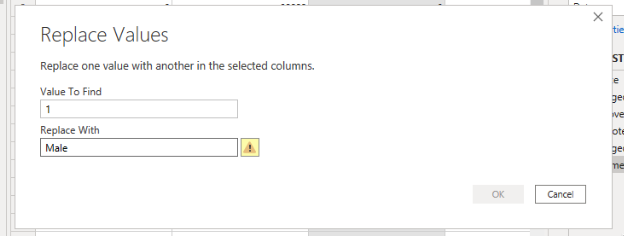
When OK button is not available like this, the data type needs to be changed.
(Whole number to Text in this case.)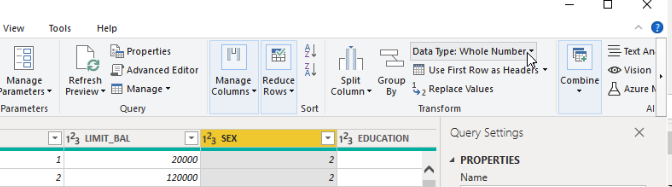
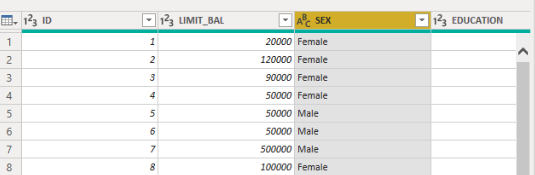
Another way to change the values
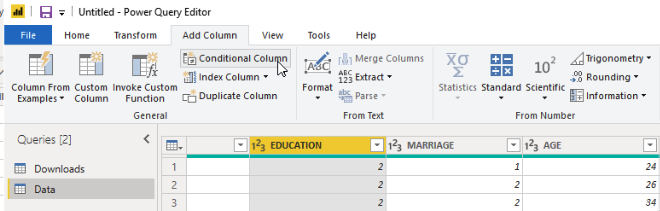
click on Conditional Column.
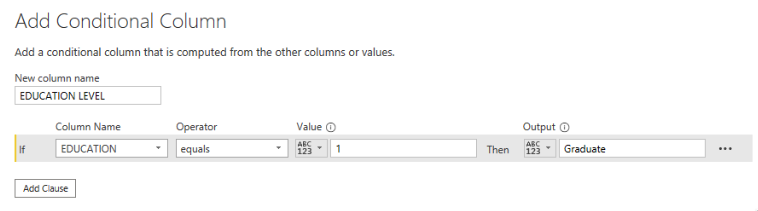
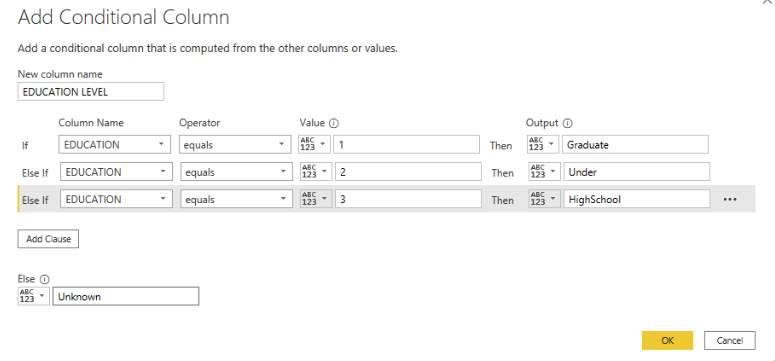
Visualization
Once data organization is done, go back to Report tab.
And add graphs and charts.
Shap Map File- Option- Preview Features- Tick 'shape map visual'